October 12, 2026 · News analysis · Robert Young
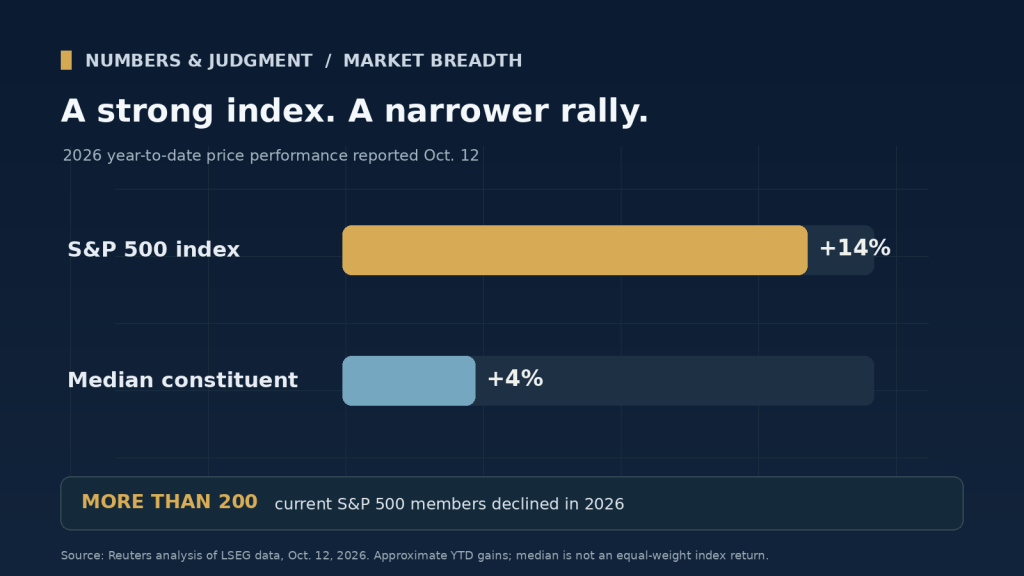
A market-capitalization-weighted index can reach a record even while a large share of its constituents struggle. That is the central tension in a new Reuters analysis: the S&P 500 has gained about 14% in 2026, but its median constituent is up only about 4%. More than 200 current members have declined. For investors, the distinction is about the concentration of returns; for CFOs and boards, it is a warning against treating an index level as a universal indicator of financing conditions.
The judgment
- Implication: Headline equity performance currently says considerably more about a few large businesses and favored sectors than about the typical S&P 500 company. That is a concentration signal, not proof of an imminent selloff.
- What would change the conclusion: A sustained rise in the share of companies above their long-term moving averages, more sectors contributing meaningfully to index gains, and stronger median-stock performance would indicate broader participation. A renewed deterioration in breadth alongside weakening profits would strengthen the concern.
- Management action: Report benchmark performance and portfolio exposure separately. In planning discussions, stress-test financing cost, demand and valuation assumptions instead of allowing a strong stock index to stand in for those variables.
What the numbers actually say
Reuters reported on October 12, using LSEG data, that the S&P 500 was up approximately 14% in 2026 while the median constituent had risen barely 4%. A quarter of the index was down at least 11%, and fewer than half of its current members traded above their 200-day moving averages. Technology accounted for more than 10 percentage points of the benchmark’s year-to-date gain; energy was up sharply as a sector but contributed less than one percentage point to the overall index.
That combination matters: a sector can perform exceptionally well without moving the index much when its index weight is small, while a heavily weighted sector can dominate the reported return. Reuters also notes a methodological boundary: its constituent-level analysis examined current S&P 500 members and excluded 18 companies removed earlier in 2026. The median figure therefore should not be described as the realized return of an investable equal-weighted index or as the experience of every investor.
The index is not the typical stock
The standard S&P 500 is weighted by float-adjusted market capitalization, so movements in larger companies count more. S&P Dow Jones Indices’ separate S&P 500 Equal Weight Index holds the same constituents but resets them to approximately equal weights at quarterly rebalances. It is a useful comparison series, not an exact substitute for the Reuters median-stock statistic: the median is one point in a distribution; an equal-weight index aggregates constituent returns under its own rebalancing rules.
A ten-percentage-point gap between the headline index’s gain and the median member’s gain is not, by itself, a valuation forecast. Strong profitability and cash generation at market leaders can justify materially different returns. Nor does poor breadth make a reversal inevitable: leadership can remain narrow for longer than a simple market-timing rule suggests. The decision risk comes from assuming that a rally reflects broad improvement when the underlying evidence is much more selective.
Where this enters a CFO’s decisions
1. Cost of capital is not one market price
A rising equity benchmark does not lower every borrower’s interest expense or improve every organization’s access to capital. Management should compare its actual borrowing spreads, covenant capacity, debt maturities and cash conversion with the market narrative. A business outside the leading sectors may face an expensive refinancing even when the index looks buoyant.
2. Valuation scenarios need a concentration check
When boards evaluate investments, acquisitions or employee-equity plans, it is tempting to carry forward market-multiple expansion. A more disciplined case separates operating value creation from market repricing. Show what the decision earns if the multiple stays flat or compresses while sales, margins and cash generation follow different paths. Do not count a peer group’s strongest performers as the median outcome.
3. Portfolio diversification needs to be measured, not assumed
An index fund can be diversified across hundreds of names while its return and risk remain materially influenced by its largest positions. That is not inherently a flaw: market-cap weighting deliberately reflects market values. But an investment committee should know the weights of its largest holdings, how correlated the investment cases are, and which exposures overlap with its other assets or operating business. A portfolio holding the index and separate large technology shares may be less diversified than its list of tickers suggests.
Three checks to make before the next board meeting
- Separate the measures. Present the cap-weighted benchmark, an appropriate equal-weight comparison, and breadth measures with their precise definitions. Do not interchange median return and equal-weight return.
- Show the sources of performance. Attribute return and risk to the largest holdings and sectors; explain whether the portfolio has benefited from concentration, genuine participation, or both.
- Translate the market signal into action. Pair downside and upside scenarios with explicit cash, refinancing, valuation, and investment decisions. Escalation points should come from the organization’s own obligations and risk tolerance, not an invented universal market threshold.
What could invalidate the concern?
The strongest counterargument is fundamental: if earnings and free cash flow at the companies carrying the index keep improving and other sectors later recover, narrow leadership may represent a transition rather than a vulnerability. That would be increasingly persuasive if a broader share of firms exceeded their long-term moving averages and contributed to gains. Conversely, continued concentration combined with worsening earnings revisions, tighter financing conditions or deeper declines across the median company would make the divergence more consequential.
The financial leadership lesson is narrower, and more usable, than ‘sell stocks.’ A benchmark reports how a particular weighting system performed. It does not establish the health of the typical company, the cost of refinancing, or the durability of a project return. Decisions should use the measure appropriate to the exposure being governed.
Further reading and useful tool
Related Numbers & Judgment analysis: AI Debt Is Becoming a Financial-Stability Risk and Household Wealth Rose While Payment Stress Worsened. For management scenario framing, use the free Forecast Scenario Planner.
Sources and method
- Reuters, Noel Randewich, October 12, 2026 — reported 2026 market performance, sector contributions, moving-average breadth, and constituent-sample methodology, based on LSEG data.
- S&P Dow Jones Indices, S&P 500 Equal Weight Index — index construction and quarterly rebalancing methodology.
Numbers & Judgment analysis interprets the reported evidence for financial planning and investment-governance decisions. Approximate performance figures reflect the cited publication’s October 12 reporting snapshot, not a live market feed. This article is general education, not individualized investment advice.


Leave a Reply